
Service activity volume in Sergipe fell 1.7% from July to August 2026 in the seasonally adjusted series, but rose 3.7% over the 12 months ending in August. Both figures from the Monthly Services Survey (PMS), released by Brazil's statistics institute IBGE on October 14 and analyzed by Sergipe's Special Secretariat for Planning, Budget and Innovation (Seplan), are consistent: the first measures the change between consecutive months, while the second compares two full-year periods.
Two other comparisons help clarify the picture: service volume was 0.7% lower than in August 2025, while the January-to-August 2026 total was 3.2% higher than in the same period of 2025. Positive year-to-date and rolling 12-month results therefore do not cancel out the latest monthly decline.
What each comparison measures
| Comparison period | Service volume | Nominal revenue |
|---|---|---|
| August 2026 versus July 2026, seasonally adjusted | -1.7% | -0.5% |
| August 2026 versus August 2025 | -0.7% | +4.5% |
| January-August 2026 versus January-August 2025 | +3.2% | +9.2% |
| 12 months ending August 2026 versus the preceding 12 months | +3.7% | +9.1% |
These rates refer to the services covered by the PMS across Sergipe state. Month-to-month comparisons are seasonally adjusted to reduce recurring calendar effects. Comparisons with the same month a year earlier and cumulative comparisons use different reference periods. The four percentages should not be added or subtracted as though they were components of a single calculation.
How can a rolling increase coexist with an August decline?
Because the measures answer different questions. The 1.7% fall means that seasonally adjusted service volume in August was below July's level. The 3.7% increase means that activity over September 2025 through August 2026 exceeded activity over September 2024 through August 2025. A decline in the final month can coexist with stronger performance over the longer period.
The 3.2% year-to-date rise also does not mean that services grew 3.2% between July and August. It compares January through August 2026 with January through August 2025. Confusing these reference periods can turn accurate figures into an inaccurate conclusion.
Service volume and nominal revenue are different indicators
Service volume is intended to track changes in activity after price effects are removed using IBGE's specific deflators. Nominal revenue reflects monetary amounts at current prices. Nominal revenue can therefore increase from a year earlier even when volume decreases. In Sergipe, nominal revenue was up 4.5% in August 2026 compared with August 2025, while volume was down 0.7%.
The difference between these two rates should not be presented as a direct measure of Sergipe's inflation or proof that a particular service raised its prices. The indices have specific methods and aggregation rules, and the state-level figures do not, on their own, identify which activity drove the changes.
How does Sergipe compare with Brazil?
Nationwide, service volume changed by -0.1% from July to August 2026, on a seasonally adjusted basis, and grew 1.7% from January through August and 2.2% over the 12 months ending in August. Sergipe's 3.7% 12-month increase was above the national rate. According to Seplan's published analysis, the state ranked sixth in Brazil and second in the Northeast region over that 12-month period. That ranking does not imply positive month-to-month growth in August.
What the survey cannot establish
The PMS is a statistical survey of formally established businesses operating in non-financial services within IBGE's defined coverage, with exclusions including healthcare and education. The broad Sergipe figures cover the state as a whole: they do not show that all 75 municipalities performed alike, nor do they separately measure each neighborhood, establishment or branch of activity.
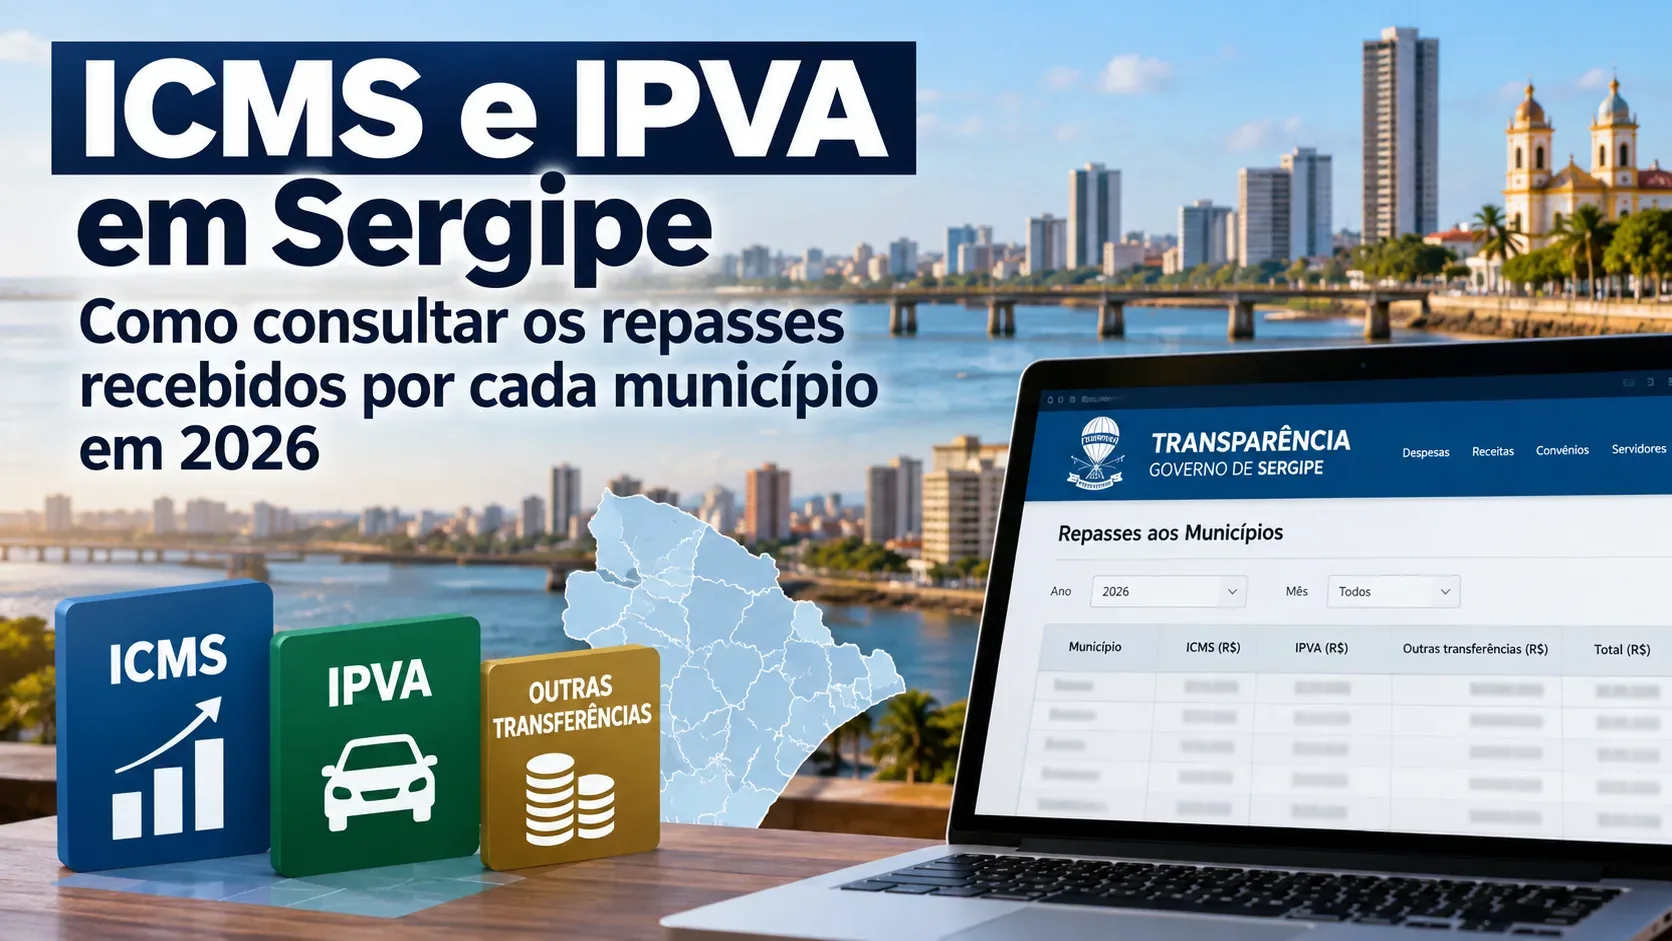
The findings describe the activity surveyed; they do not automatically explain its causes or predict employment, future revenue or a rebound in the following month. The cover artwork is illustrative, and its chart does not reproduce IBGE's official statistical series.
When will the figures be updated?
This account uses August 2026 data published on October 14, 2026. In the PMS calendar checked on October 25, IBGE scheduled the release of September 2026 results for November 11, 2026. Survey figures may be revised in later releases. Any assessment of a change in trend needs subsequent observations rather than treating a single month as a definitive diagnosis.